From GitLab Issues to a Management Cockpit: Our PM-Suite
GitLab CE tracks work well: issues, boards, milestones, time tracking. What it lacks is a management layer across projects. Epics, iterations and roadmap reports are Premium and Ultimate features per the GitLab documentation (checked October 2026); we stay on self-managed CE (see GitLab CE vs. Premium).
The questions were always the same: what is at risk, what ships when, who is overloaded? Answering them meant rebuilding the picture in a spreadsheet that was outdated before it was finished.
So we built the PM-Suite for the IT team at SPL Tele: a read-only portfolio, roadmap and controlling view on top of our GitLab instance. At the time of writing it covered about 50 projects and some 330 issues.
In this article · 7 min read
- What it is, in architecture terms
- One question per page
- Cockpit: 30 seconds to the first answer
- Portfolio: a traffic light with a reason
- Roadmap: sprints as bands, issues as bars
- Sprints: burnup and an honest forecast
- Capacity: the heatmap the team actually looks at
- Control: are we keeping our commitments?
- Issues: the list behind every number
- Help: a definition for every number
- Project pages, dark mode, mobile
- How it differs from our sprint planning tool
- What it does not do
Key takeaways
- GitLab CE tracks work per project but has no portfolio, roadmap or management view. Premium adds epics, iterations and roadmap reports; a read-only layer closes the gap for teams on CE.
- The PM-Suite is one container, server-rendered, no database, no npm packages, no own planning data. It reads GitLab and writes nothing.
- One question per page beats one page with every chart.
- The value is not the traffic light but the documented definition behind it and the trace back to a GitLab issue.
- The limits are part of the product: read-only, German, internal, only as good as the data in GitLab.
What it is, in architecture terms
One container, Node.js 24, no npm packages, no database. The suite renders server-side HTML and reads GitLab through REST and GraphQL: REST for projects, issues, estimates and links, GraphQL for board column and card order.
No own planning data
Sprints are issues in a dedicated project, work packages link to them, capacity comes from a report written every five minutes by a CI job. The suite aggregates.
Read-only by design
Read-scope token, no forms, no write API. The only “write” is the refresh button discarding the app’s own cache.
There is no login: the service runs inside our network and shows only what the IT team already sees in GitLab. Missing data renders as a dash, never as zero.
One question per page
The navigation follows the questions, not GitLab's object model. The German page names match the screenshots.
What needs attention now?
What is at risk?
What comes when?
How is the sprint going?
Who has room?
Do we keep commitments?
What is to do?
How is this calculated?
How does this project stand?
Cockpit: 30 seconds to the first answer
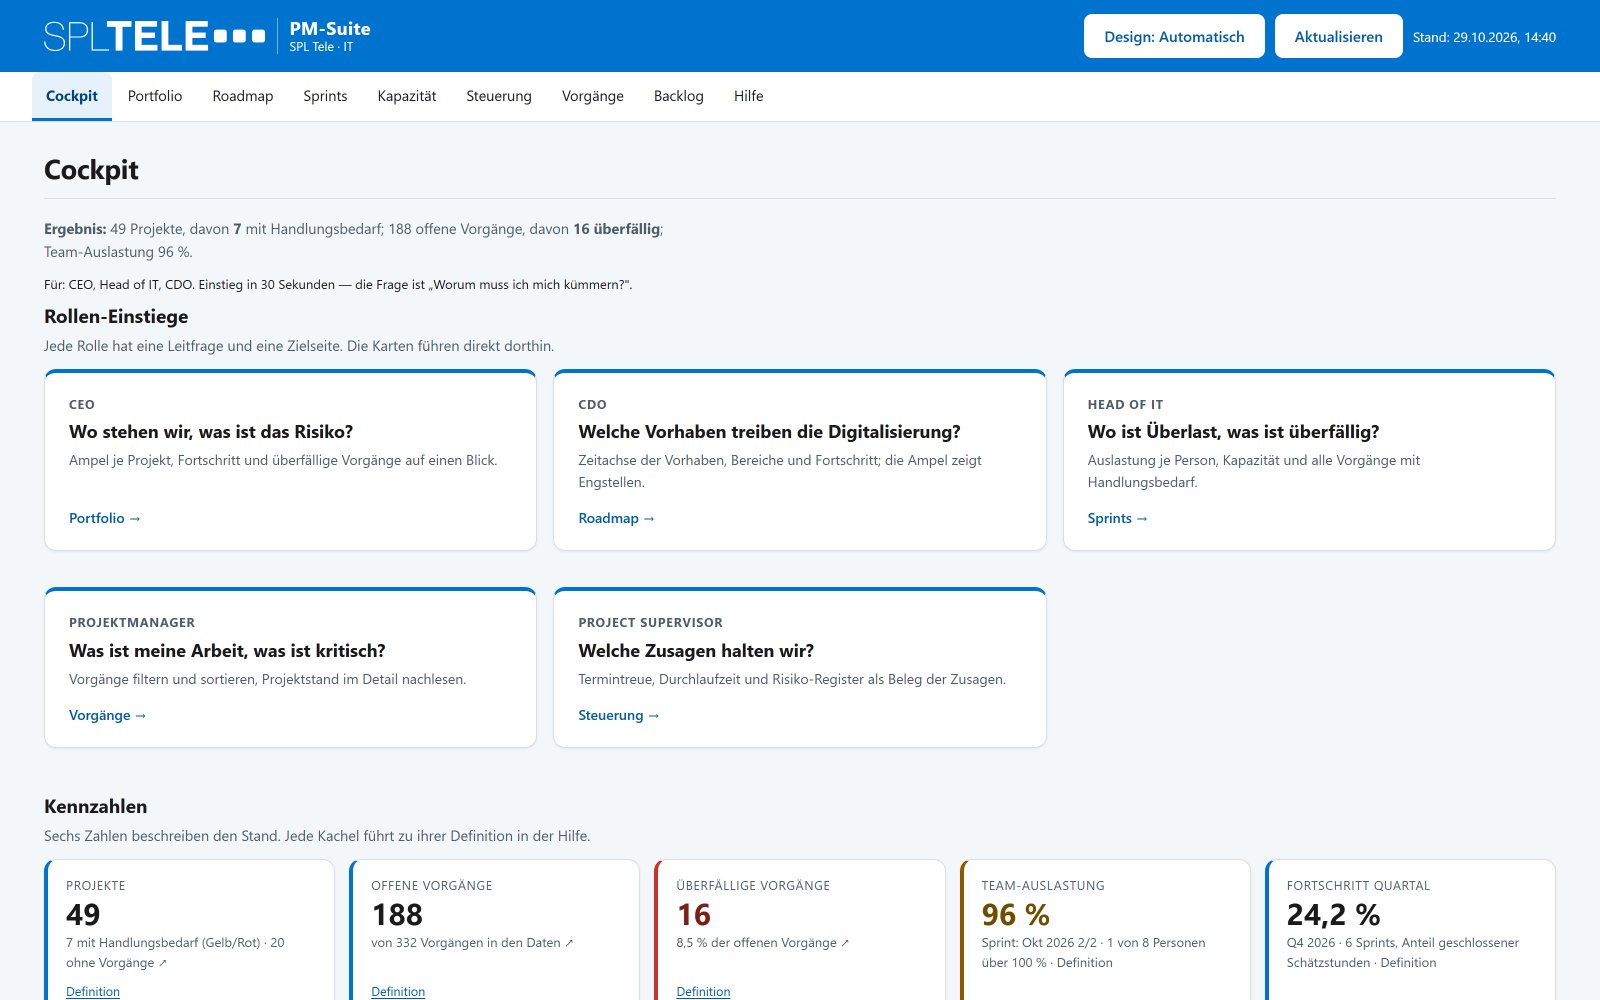
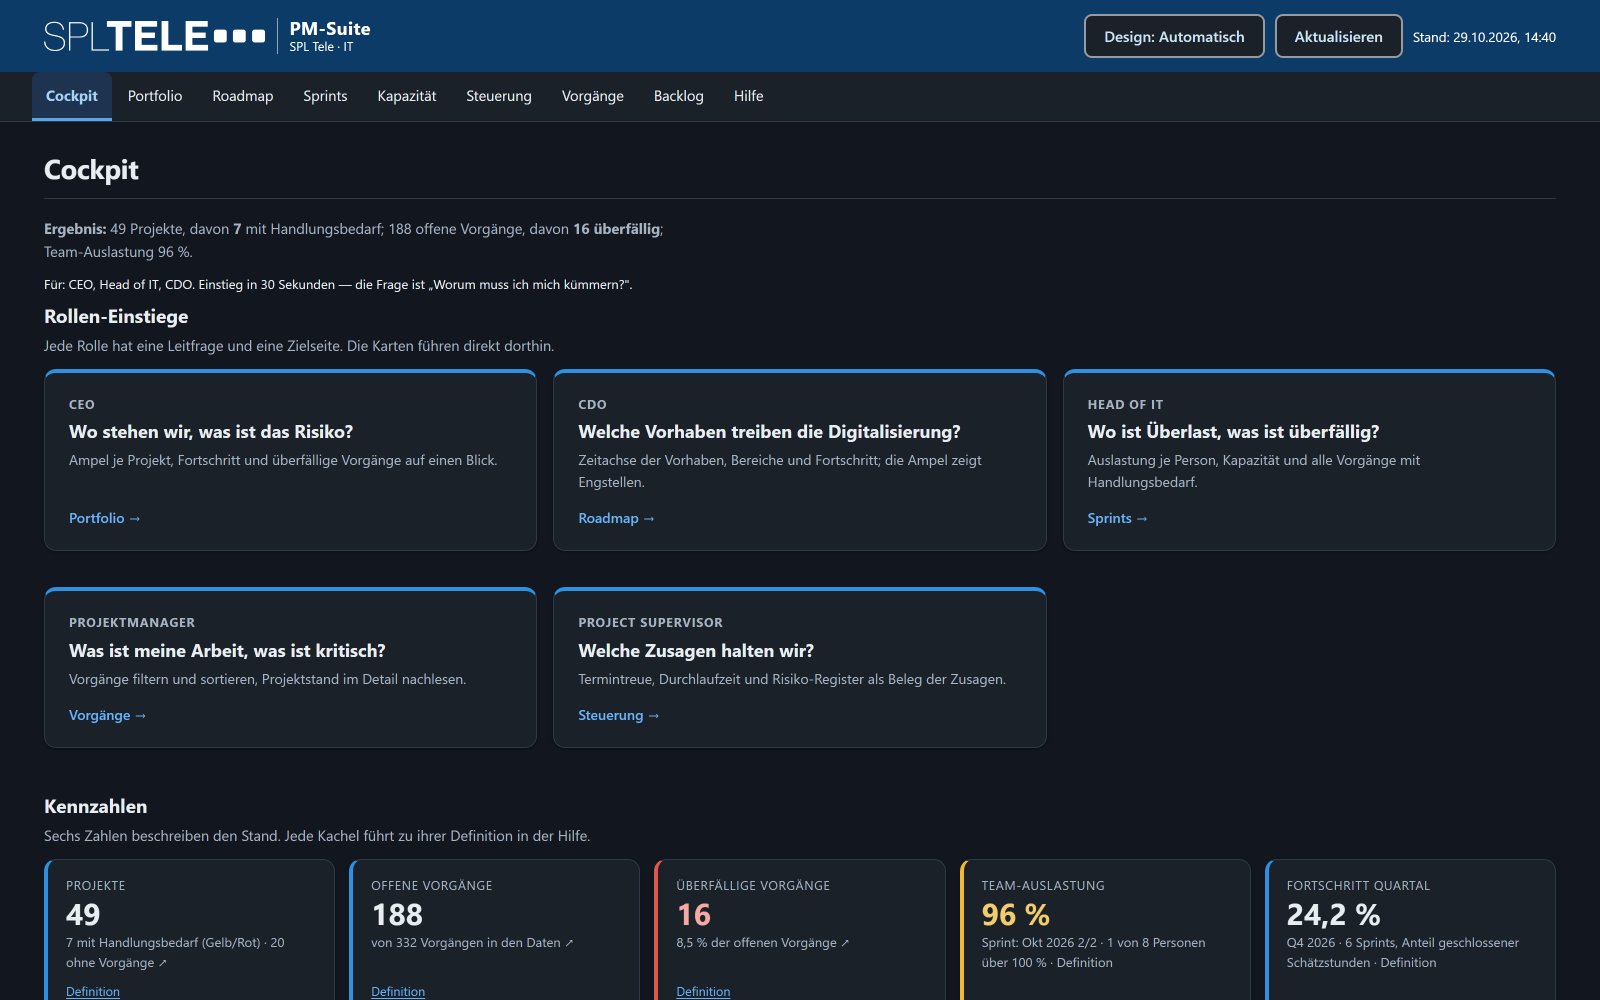
The cockpit opens with five role entries (CEO, CDO, Head of IT, project manager, project supervisor), each linked to its target page. Six KPI tiles follow: projects, open issues, overdue issues, team utilization, quarter progress, data quality.
The portfolio traffic light is four vertical columns (red, amber, green, grey); a click opens the filtered project list. A table names the riskiest projects and states the reason. Below: the running sprint, upcoming due issues, notices by severity, last movement, data sources and status.
Every page shows the time of the last fetch and a refresh button that discards the 60-second cache and never writes to GitLab. If a source fails, the page keeps the last state and names the missing source.
Portfolio: a traffic light with a reason
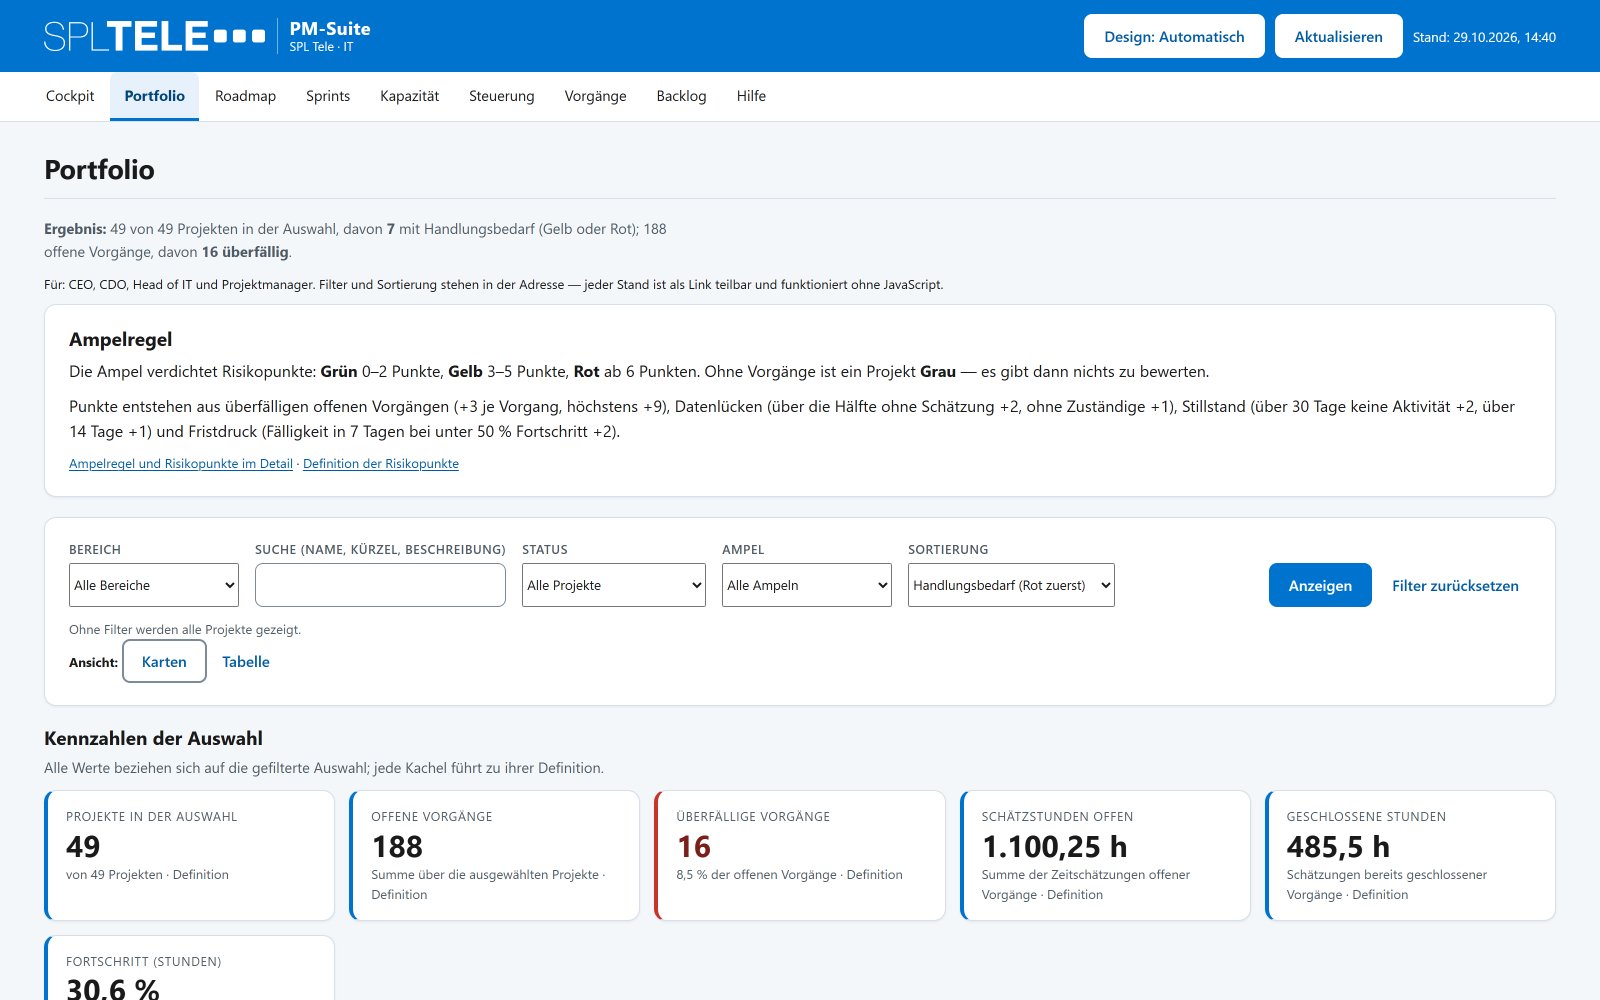
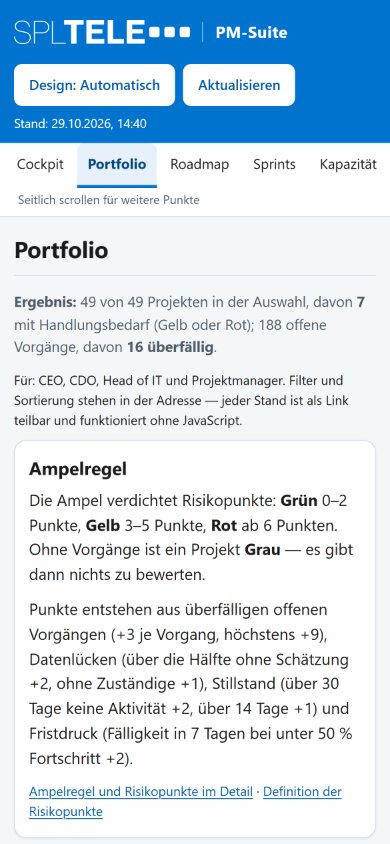
The traffic light is a rule: +3 per overdue open issue (max +9), +2 if more than half of the open issues lack an estimate, +1 if more than half lack an assignee, +2 or +1 for inactivity over 30 or 14 days, +2 if a due date is within seven days while progress is below 50 percent. Zero to two points is green, three to five amber, six or more red, grey without issues.
Filters cover area, status, traffic light, search and sorting, with card and table views. Filters live in the URL, so a view is shareable and works without JavaScript. Code and help share one rule.
Roadmap: sprints as bands, issues as bars
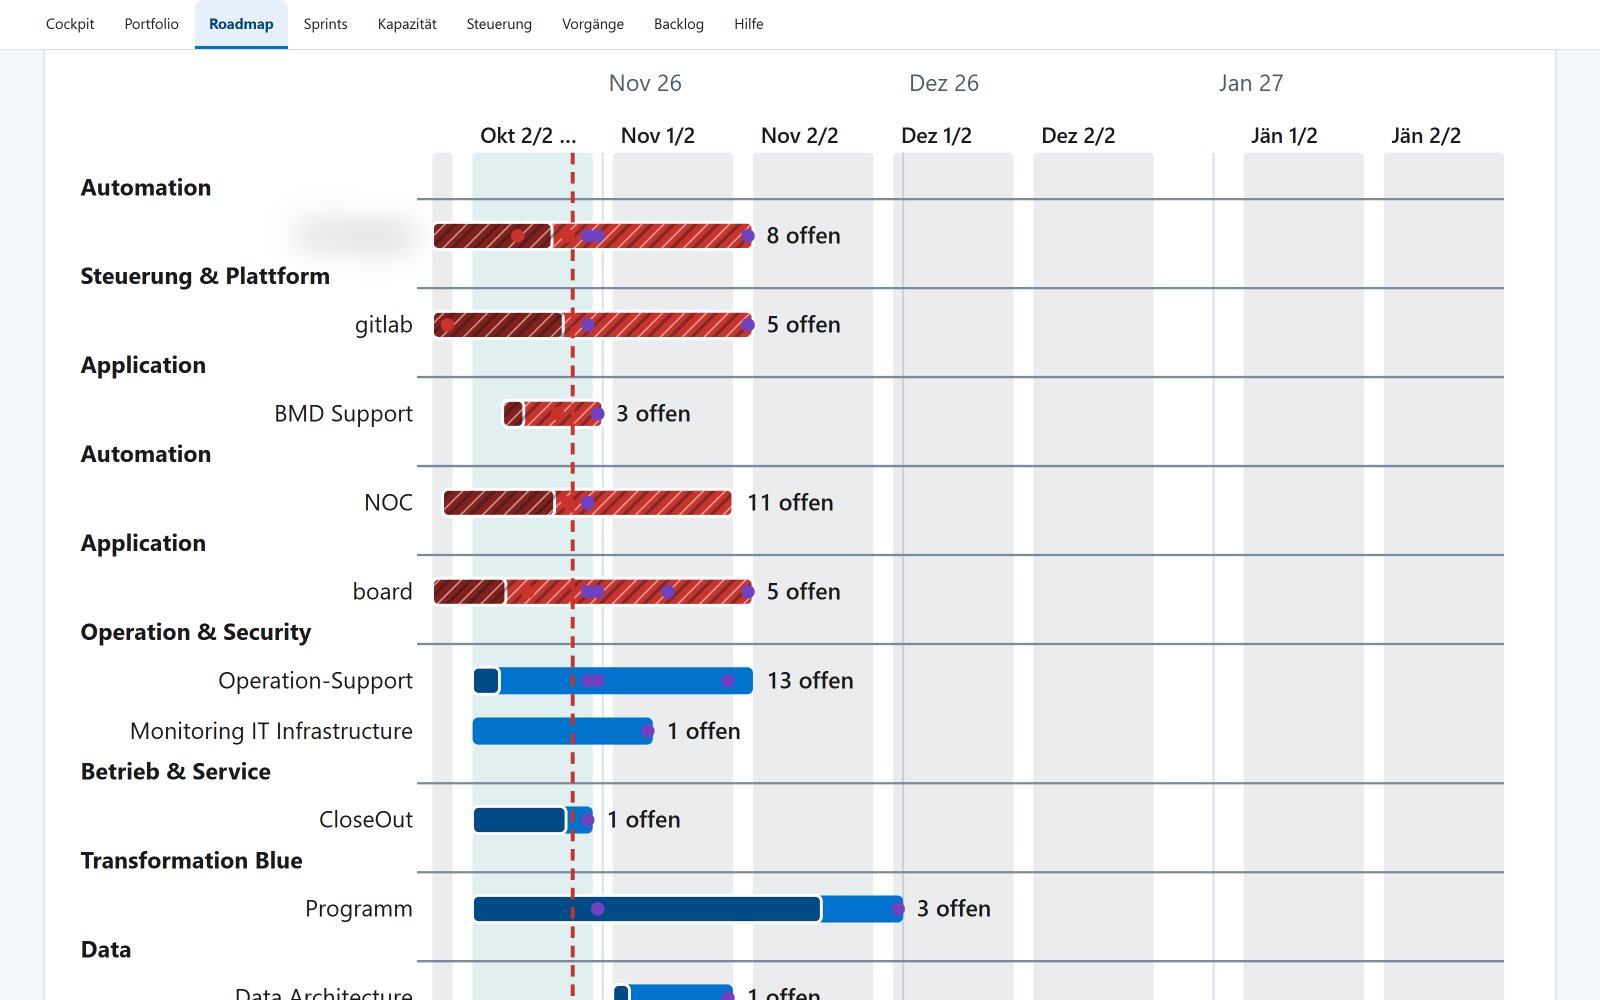
CE has no group roadmap and no epics, so the roadmap uses two objects that exist: sprints as bands across the top and issues with a start and due date as bars. One row per project: the bar spans earliest start to latest due date, the fill shows progress by closed estimate hours, the number at its end counts open issues; due dates are markers, max eight per row. Overdue bars are red and hatched.
Project and group milestones exist in CE; the roadmap uses project milestones because that is where the due dates sit. They form a table below the chart with due date, status and open versus total issues. No dependency arrows, no rescheduling; whether a date holds is a question for the Control page.
Sprints: burnup and an honest forecast
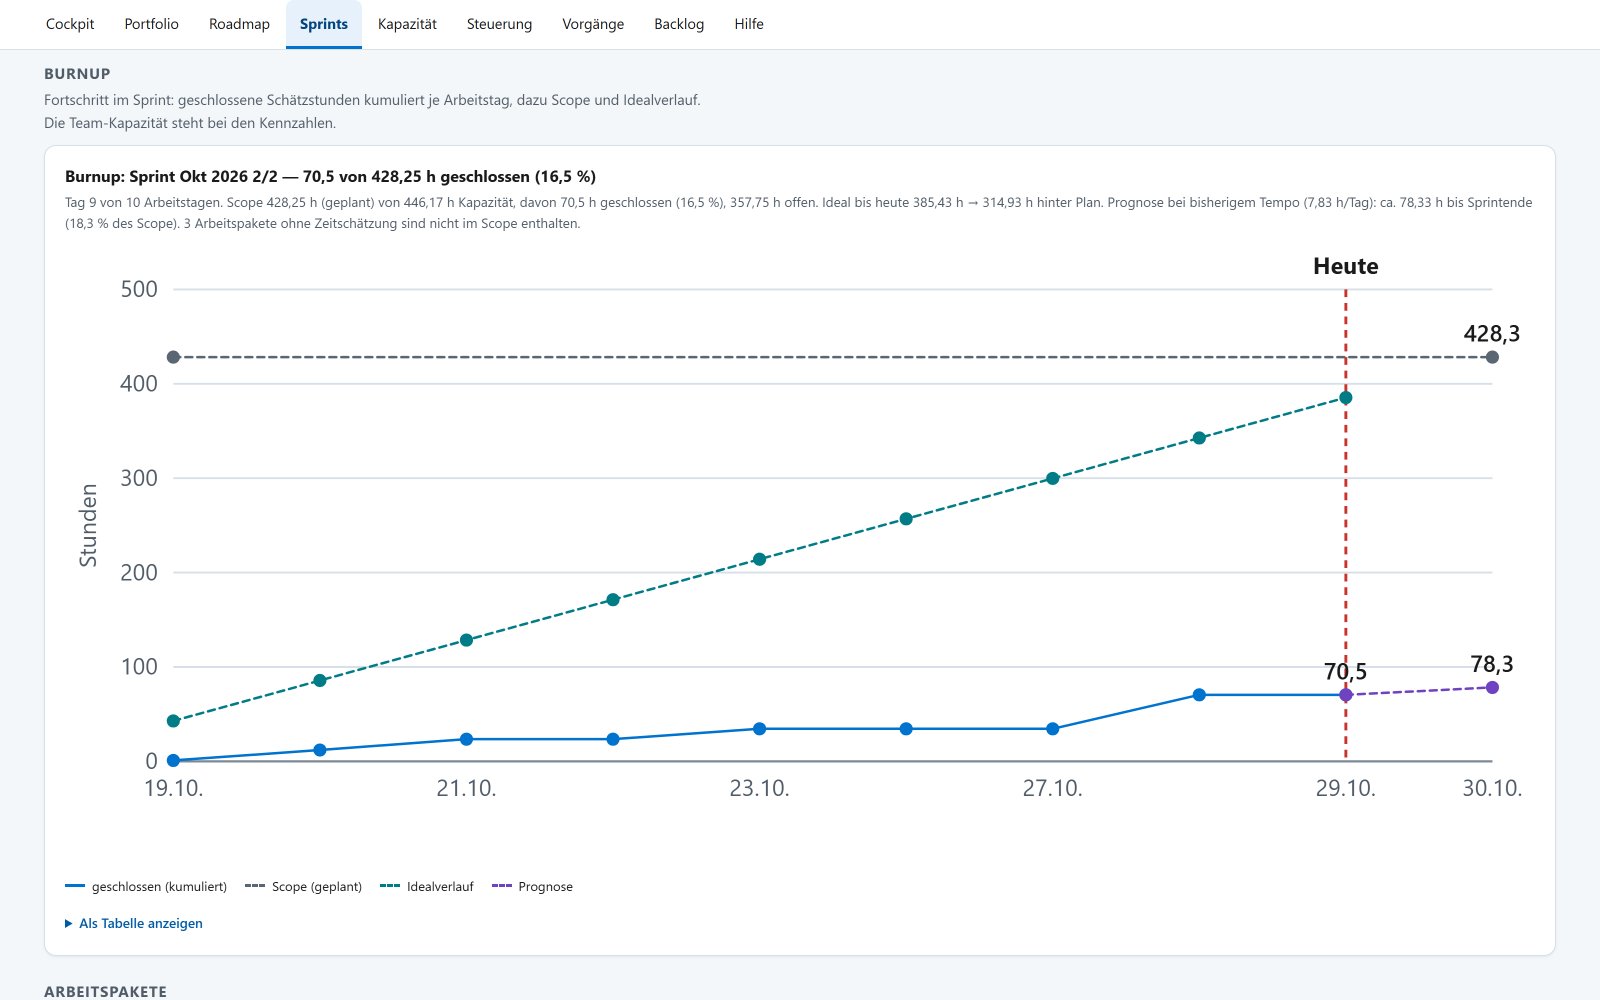
The sprint page lists all sprints with period, capacity, planned hours, utilization and progress; selecting one opens progress by count and estimate hours, remaining hours and a per-person table. The burnup plots cumulative closed estimate hours per working day against scope and an ideal line. The forecast is simple: closed hours plus current pace times remaining working days; at the time of writing it was well below scope. Velocity compares scope and closed hours per sprint, with a dashed average over completed sprints only.
Capacity: the heatmap the team actually looks at
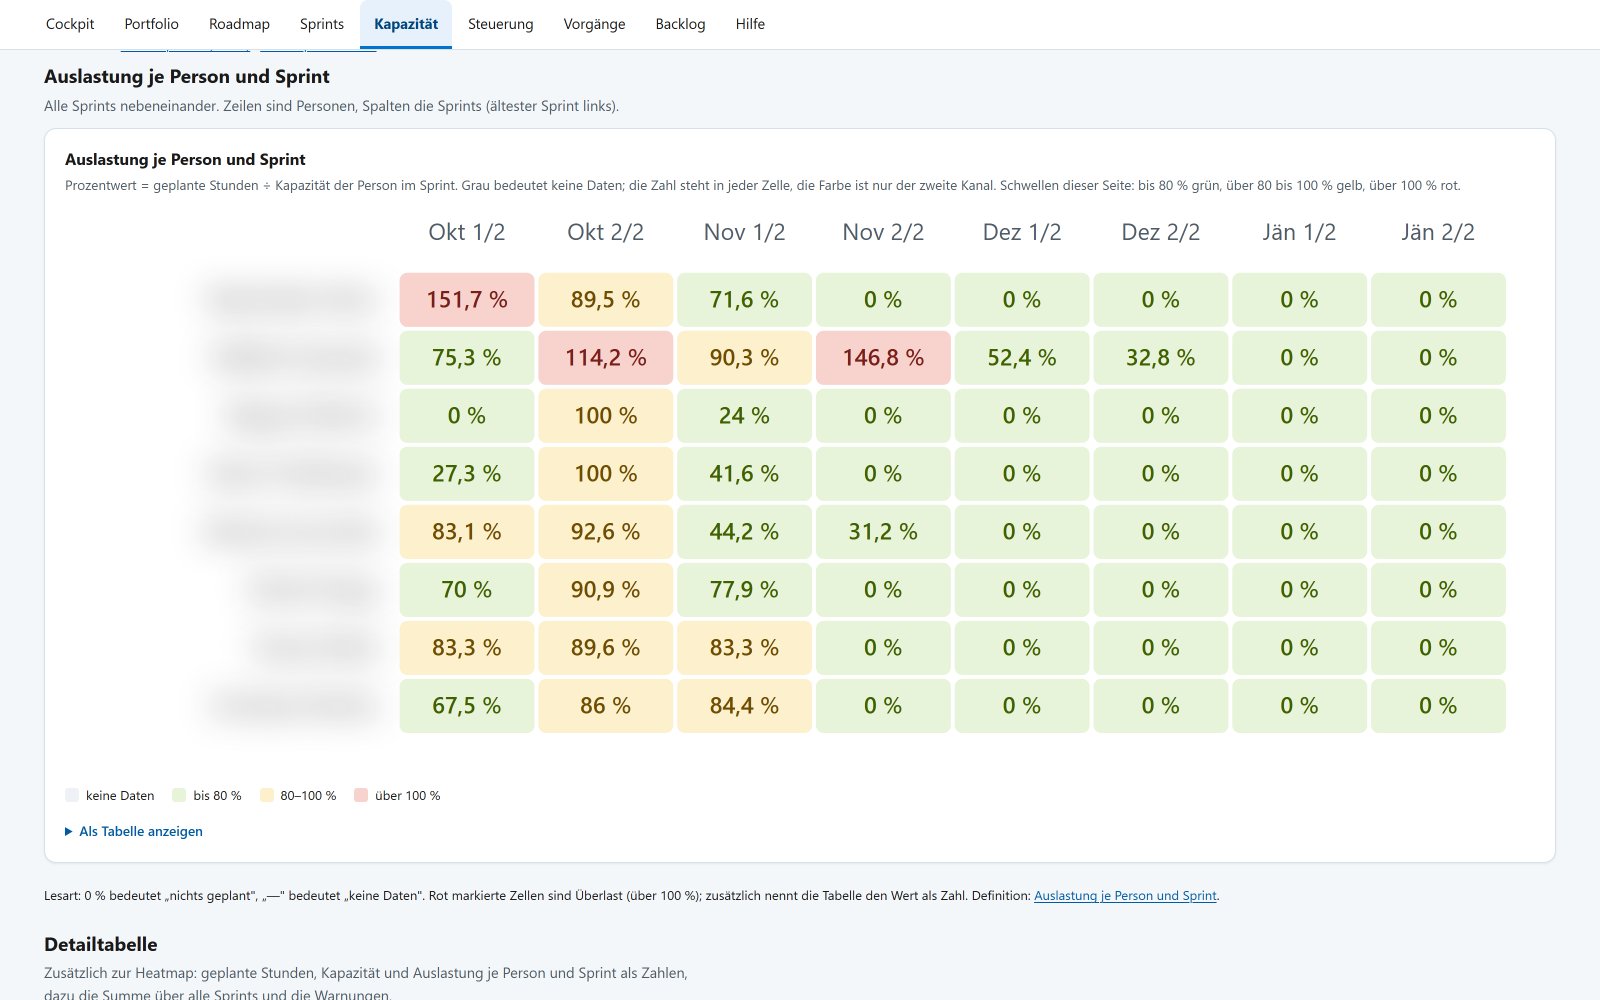
Rows are people, columns are sprints. Each cell shows planned hours against capacity as a percentage, the number in the cell and color as a second channel: up to 80 percent green, 80 to 100 yellow, above 100 red, grey without data. Capacity comes from FTE, working days, a daily hours model, holidays and planned absences. The page separates the free buffer (positive remainders, the part that can be redistributed) from the net remainder (including negative values). Overloaded people are listed with sprint and gap; the suite reassigns nothing.
Control: are we keeping our commitments?
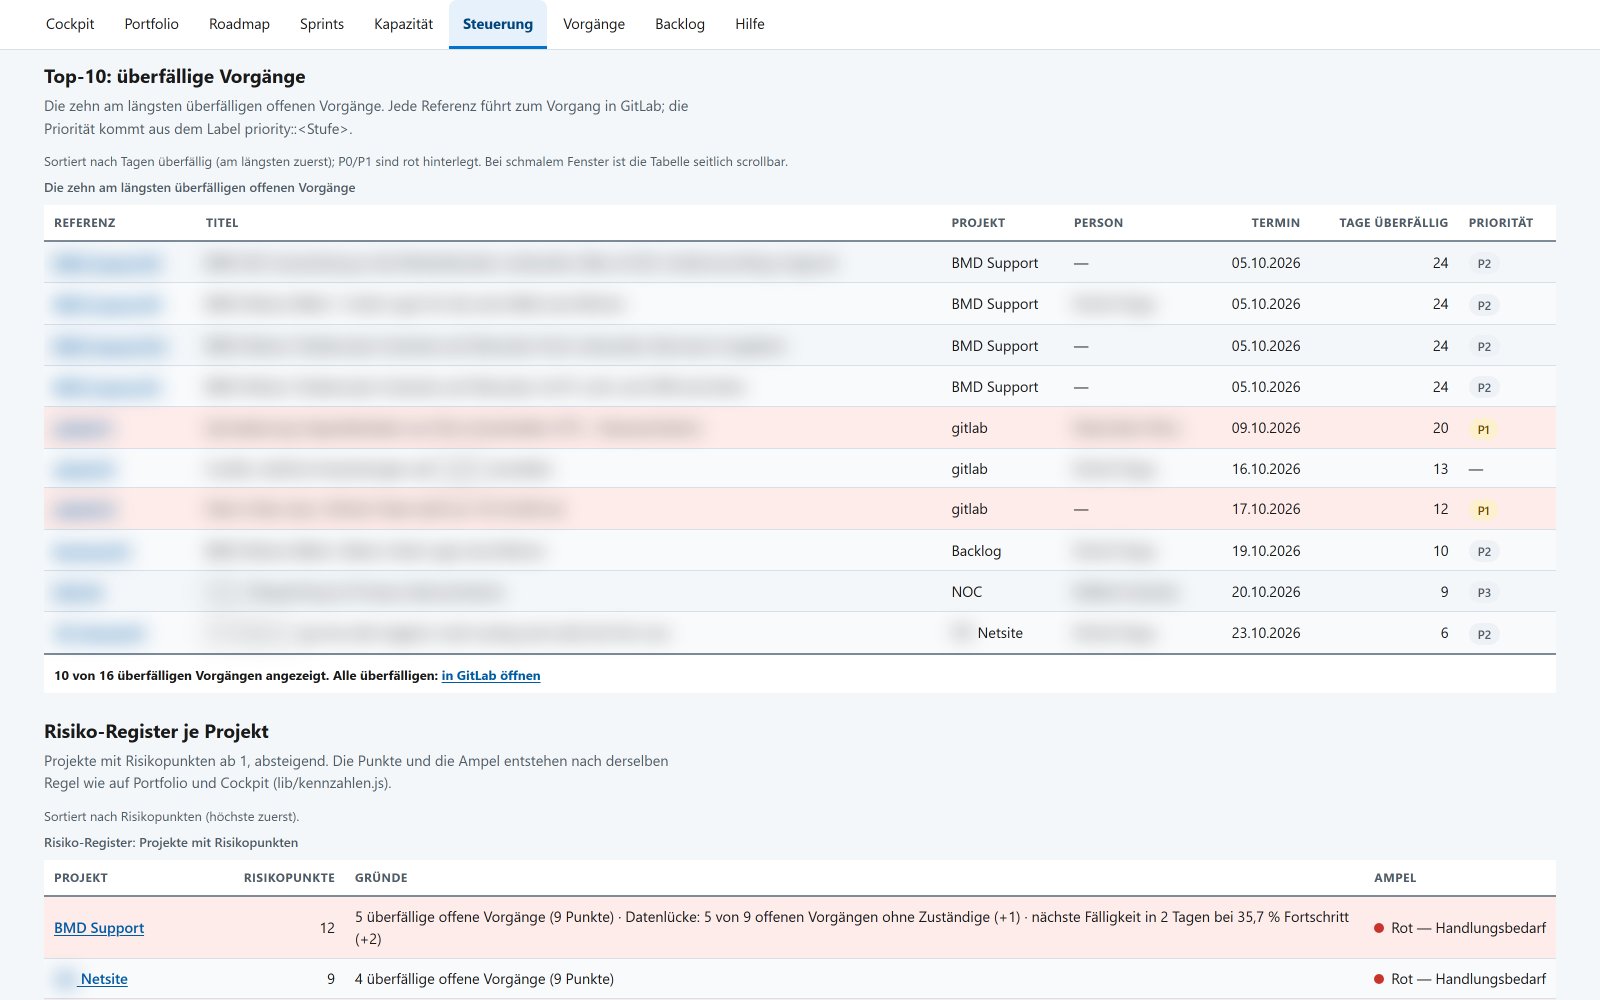
The page for uncomfortable questions: lead time median and average, on-time delivery, work in progress, overdue issues, age of open issues, velocity, created versus closed issues per week over 12 weeks, the ten longest-overdue issues, the risk register with reasons, and data quality. Data quality names the share of open issues without estimate, assignee or due date and links into the matching GitLab filter, so the page ends in a work list. Where CE has no filter, it says so.
Issues: the list behind every number
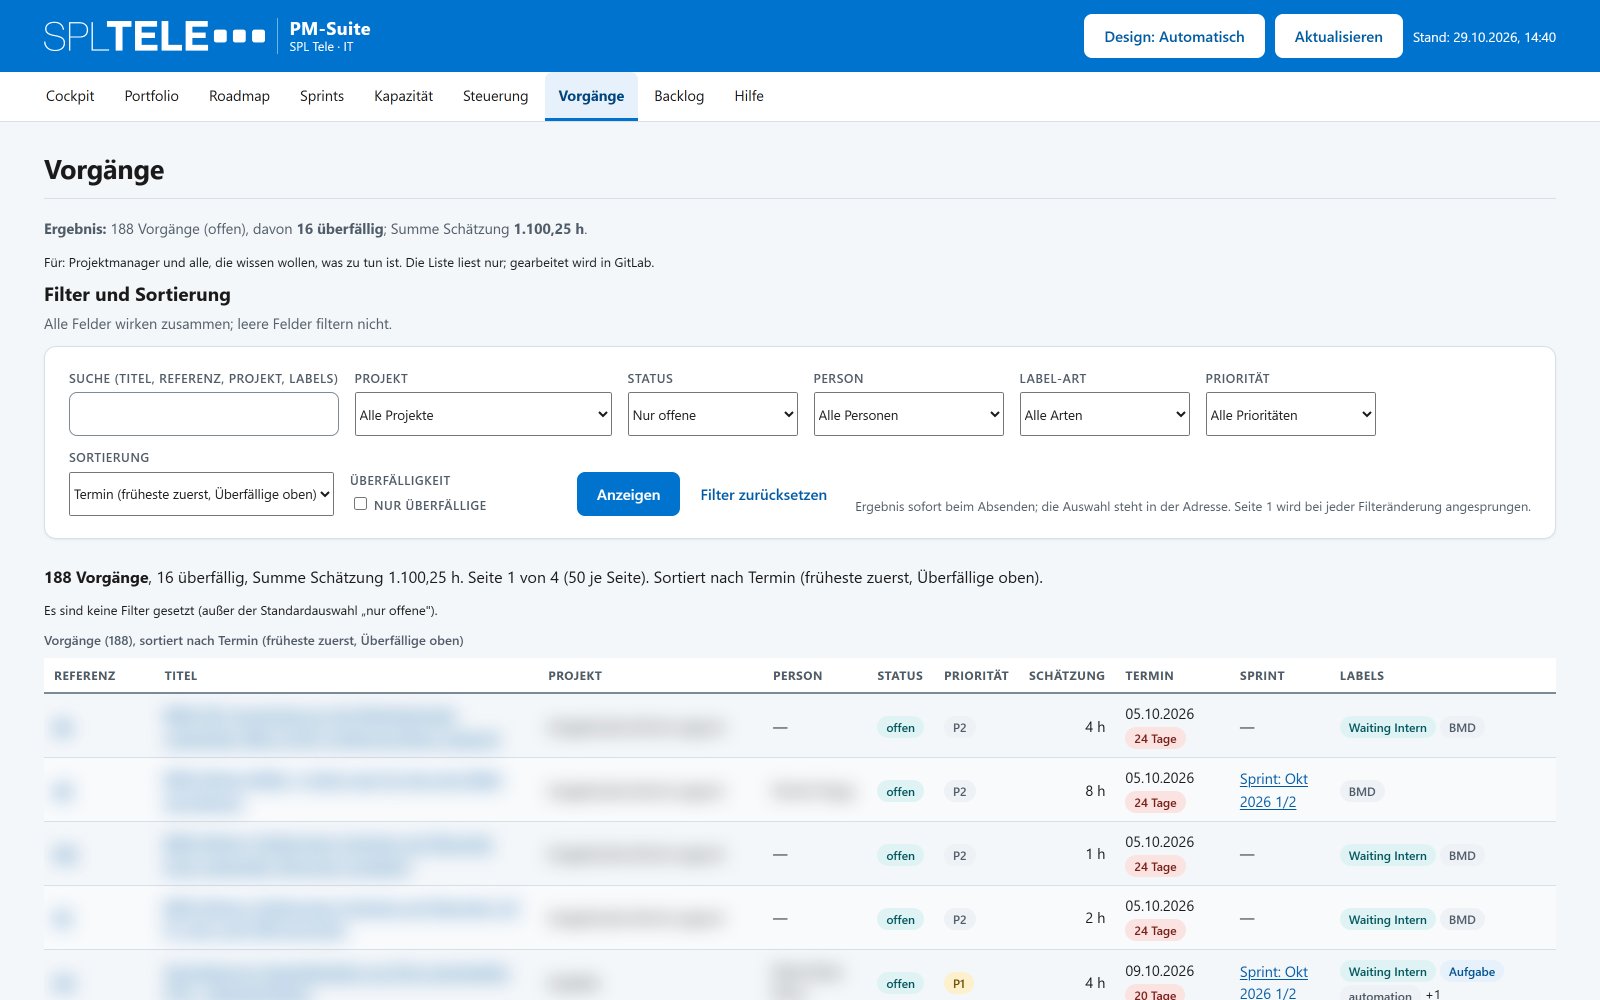
Every number leads back to an issue list. Filters cover search, project, status, person, label type, priority and overdue state. The header shows count and sum of estimates; the table carries reference, title, project, person, status, priority, estimate, due date, sprint and labels, 50 rows per page. Read-only: work happens in GitLab.
Help: a definition for every number
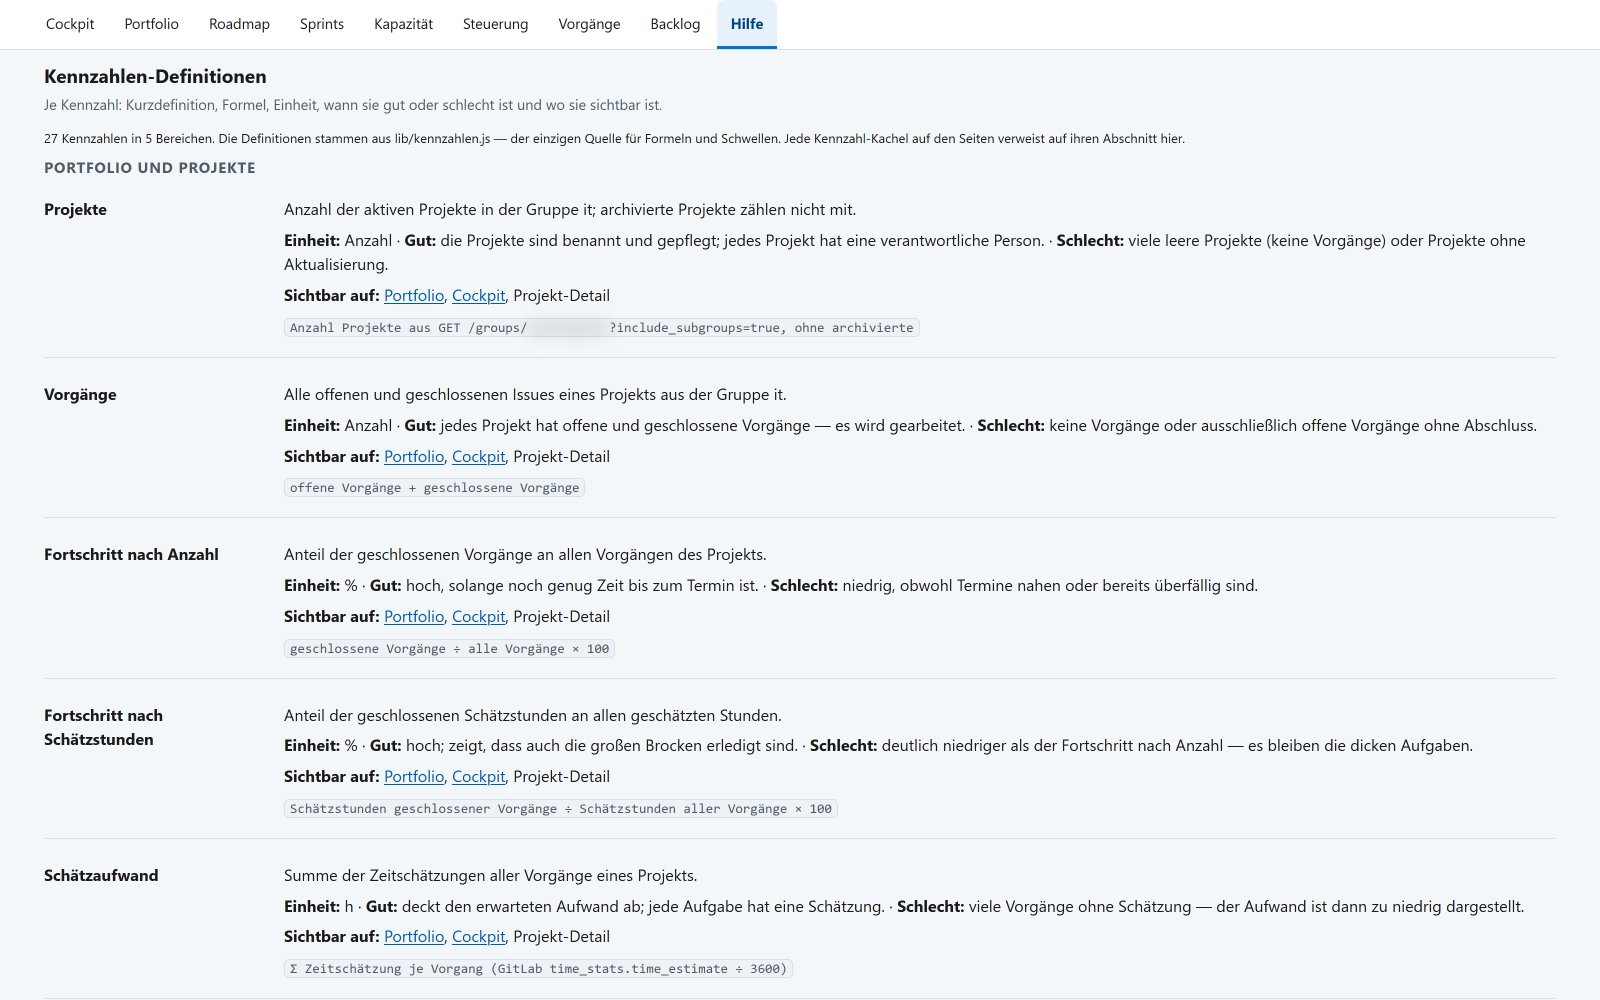
Twenty-seven metrics in five groups with formula, unit and a good/bad reading. Thresholds are tables, not prose. Definitions come from one module in the code and the help page reads the same source, so a formula cannot drift from its explanation; every KPI tile links to its anchor.
Project pages, dark mode, mobile
Each project has a detail page: traffic light with risk points and reasons, key figures (open, overdue, progress, open estimate, booked time, last activity), the description, weekly created and closed issues, issue list, and people with open issues and open estimate hours. No profiles, no performance ranking.
Light and dark mode follow the system setting and can be switched. The UI is server-rendered and works without JavaScript, charts are server-generated SVG with a table alternative; at 1440 and 390 pixels there is no horizontal overflow.
How it differs from our sprint planning tool
We built a sprint planning view for GitLab CE first, described in We built our own sprint planning view. Both read GitLab and answer different questions: the sprint planning view is operational (who works on what, planned and booked hours, overload), the PM-Suite is the management layer (portfolio, roadmap, delivery metrics, capacity across sprints). We did not merge them; a planner needs different granularity than a CEO. What they share is that GitLab stays the only place where planning data is written.
What it does not do
- Read-only: changes happen in GitLab, the suite shows the effect at the next refresh.
- Metrics are only as good as the data: labels, estimates, due dates and assignments are the input; gaps show as gaps, not as zero.
- No planning tool: no backlog ordering, no new issues, no time booking.
- No roadmap dependencies: CE has no epic links, and we did not want a second relationship model.
- German UI, internal deployment: choices, not gaps.
- Capacity needs a report that needs an export; without it there is no invented utilization.
The same principle is behind ALEM, our lifecycle and engineering model: the source of truth stays where the work happens.