We Built Our Own Sprint Planning View for GitLab CE
In this article · 7 min read
- The gap: GitLab knows the work, not the workload
- One Node.js process, no database
- Six tiles for the running sprint
- Sprint cards: commitment, capacity, actuals
- Capacity per person
- Work packages per project
- From a number to the list behind it
- The backlog board
- How the numbers are created
- Light, dark, phone
- What it does not do
Key takeaways
- GitLab CE holds estimates and tracked time; the missing layer is capacity.
- A server-rendered, read-only page with no database was enough.
- The overload banner and the capacity table turn a static table into a daily check.
- Plan and actual in the same row: estimates and tracked time per sprint, person, and package.
- The view is only as good as estimates, labels, and maintained absences.
The gap: GitLab knows the work, not the workload
GitLab CE knows our work: every issue, its estimate, its labels, the person assigned to it, and the time booked against it. What it does not know is the number a team lead needs before the sprint starts: how many hours of planned work sit on each person's desk compared to the hours that person actually has.
Our team is not uniform. Part-time contracts, public holidays, vacation, overtime, and compensation time change the available hours from sprint to sprint. GitLab has no model for that. A milestone shows progress and the time already spent, not the sum of estimates. A milestone per project would also split one sprint into as many views as we have projects.
For a while the calculation lived in a Markdown table inside an issue, refreshed by a script every few minutes. It was accurate and slow to read: no detail behind a number, no time tracking, no phone. So we built a page that turns what GitLab already holds into a view the team opens before and during the sprint. The issue stayed as the data source and the history; the page replaced it as the reading place.
One Node.js process, no database
It runs in production for SPL Tele's IT team: one server-rendered Node.js process, no client-side framework, no own database. It reads the GitLab API for issues, labels, estimates, time tracking, and sprint issues, plus a capacity report that a scheduled pipeline writes from GitLab data and FTE and absence exports from Rimo, our project management system.
The page never writes an issue or an hour. The only action it can trigger is the refresh: the button starts the report pipeline, and the page polls until the report carries a new timestamp. When a source fails, the page keeps the old timestamp and says so.
Dashboard
Who is overloaded in the current or an upcoming sprint, and how much capacity is left?
Sprint card
What did we commit to, what is booked, and what capacity remains after holidays and absences?
Capacity table
How many hours are planned for each person against their real working time?
Work packages per project
Which project consumes the plan, and which packages carry the hours?
Time tracking
How much of the estimate is already spent, per sprint, person, and package?
Backlog board
What waits outside the sprint, and how big is the queue?
Six tiles for the running sprint
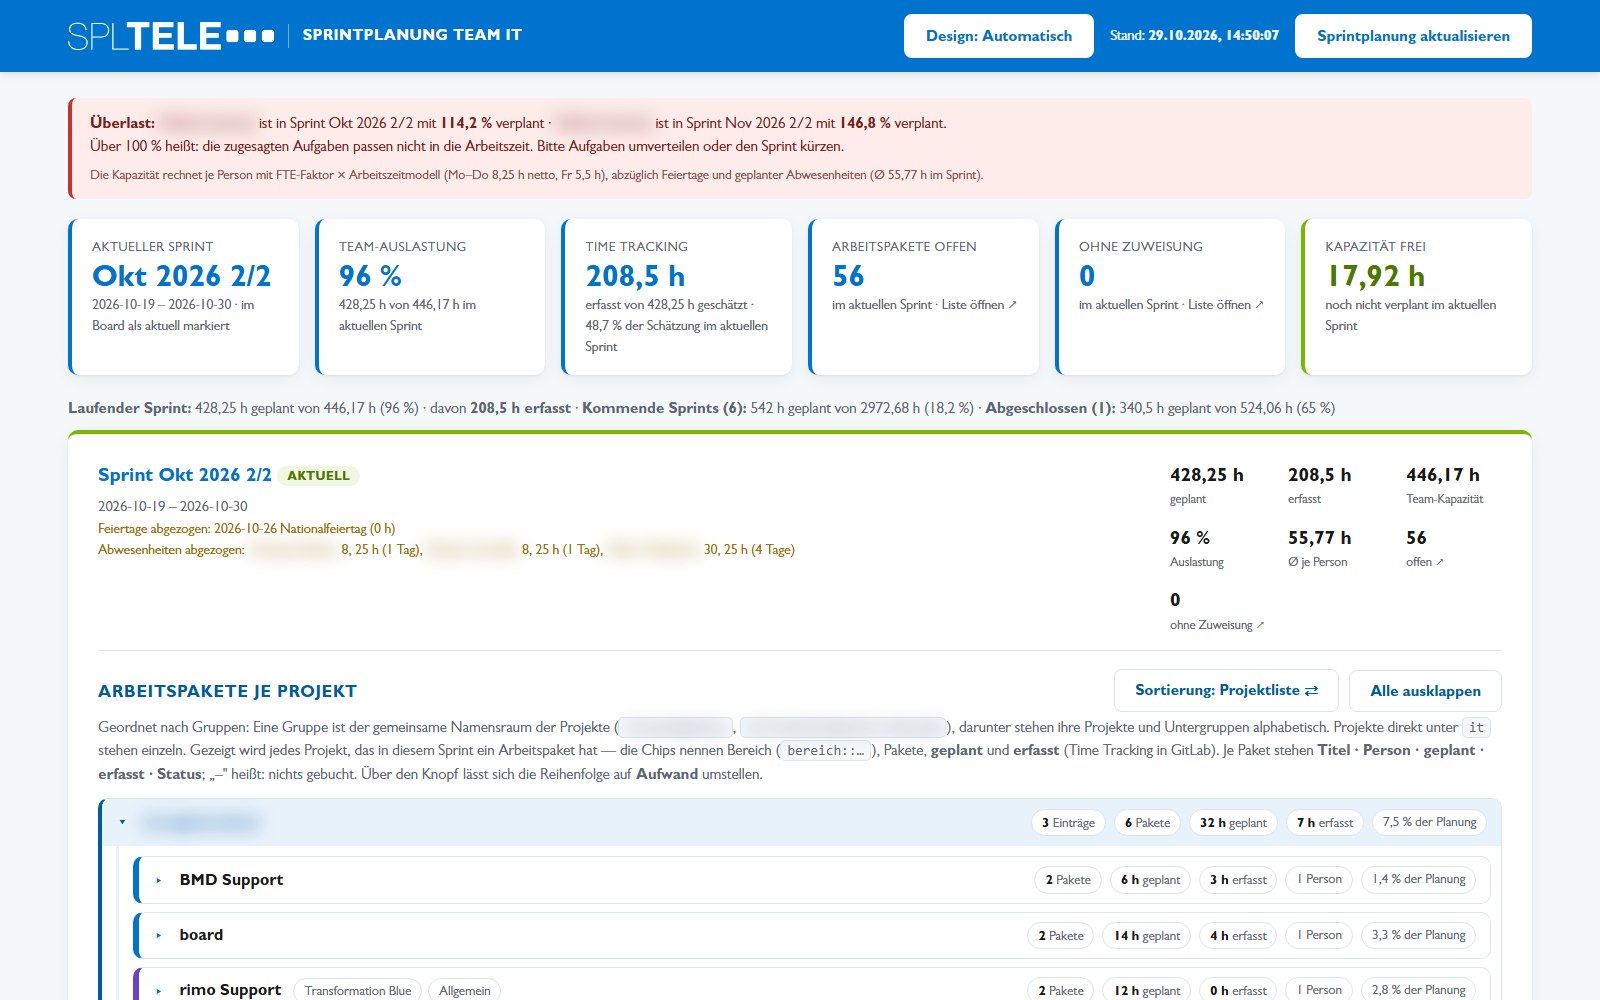
The dashboard opens with the sprint marked as current in the sprint project, not with the calendar. That matters between two sprints: the calendar says none is running, the board says the next one already is.
Six tiles summarize it: the current sprint with its date range and board status, team utilization, time tracking with booked against estimated hours, open packages, packages without an assignee, free capacity.
If anyone is above 100%, a red banner names the sprint and the percentage and says what to do: redistribute work or shorten the sprint.
Two tiles are links; a number you cannot inspect is a claim, not a plan.
Sprint cards: commitment, capacity, actuals
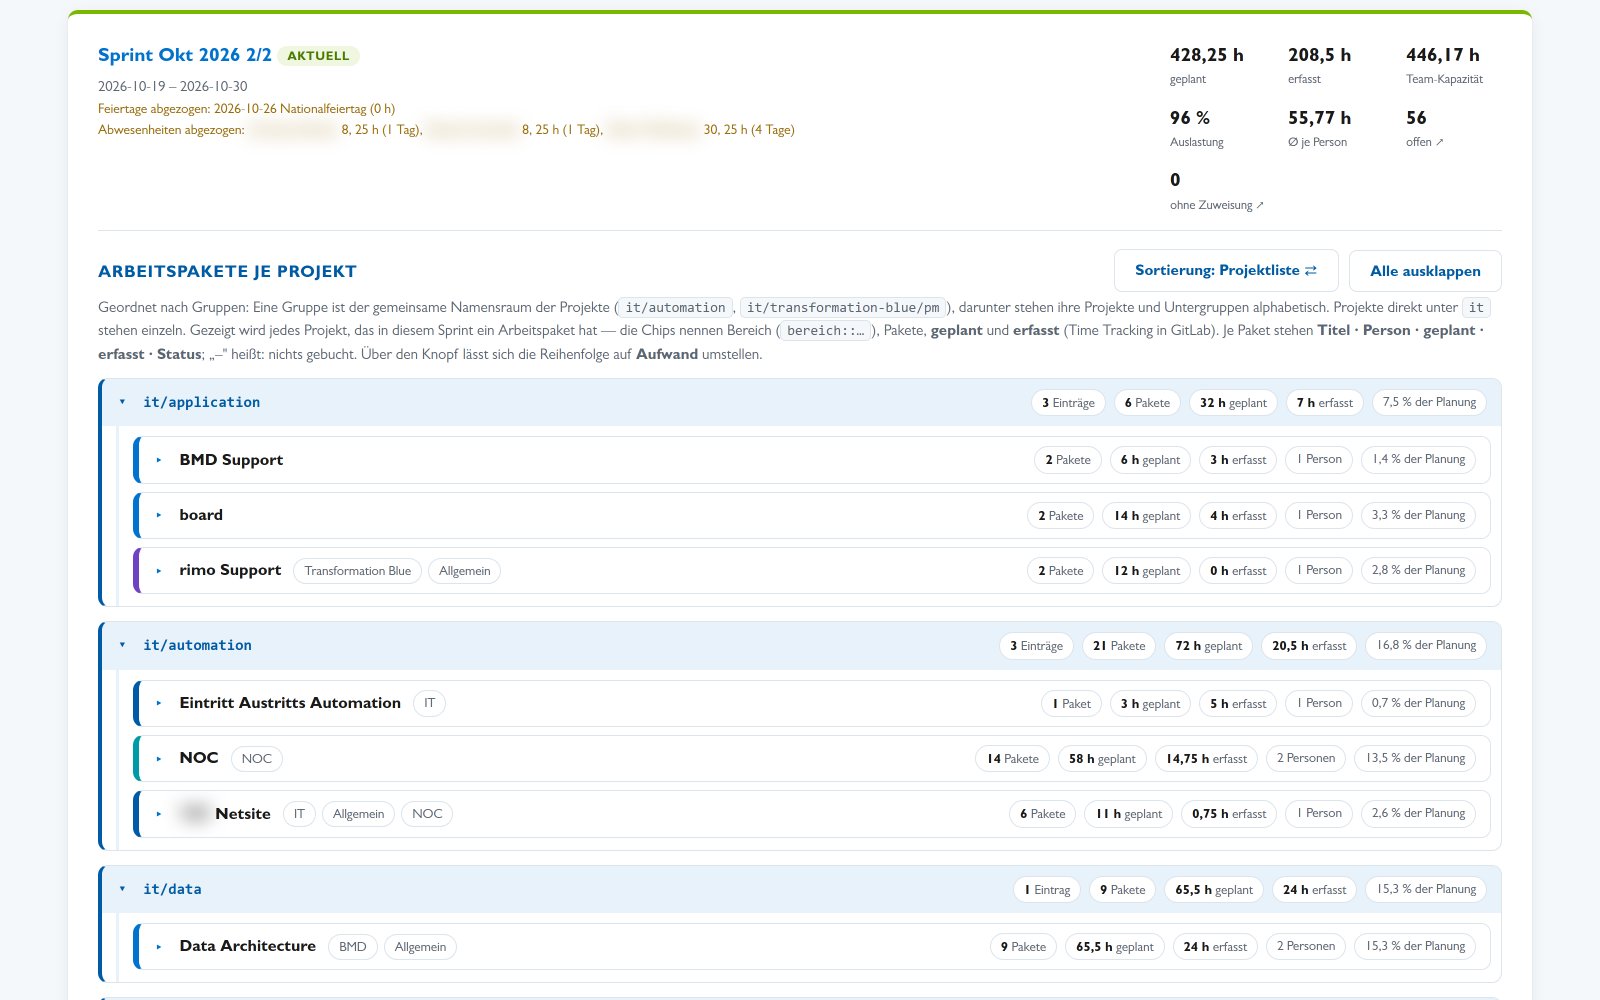
The page shows the running sprint and the two after it; the third sits in a collapsible bar. Each card names its state, the date range, and what was deducted: public holidays and planned absences with hours.
Then the numbers: planned, booked, team capacity, utilization, average capacity per person, open packages, unassigned packages.
Utilization is planned divided by capacity, not progress. A sprint can be fully planned and still have most of its work open.
Capacity per person
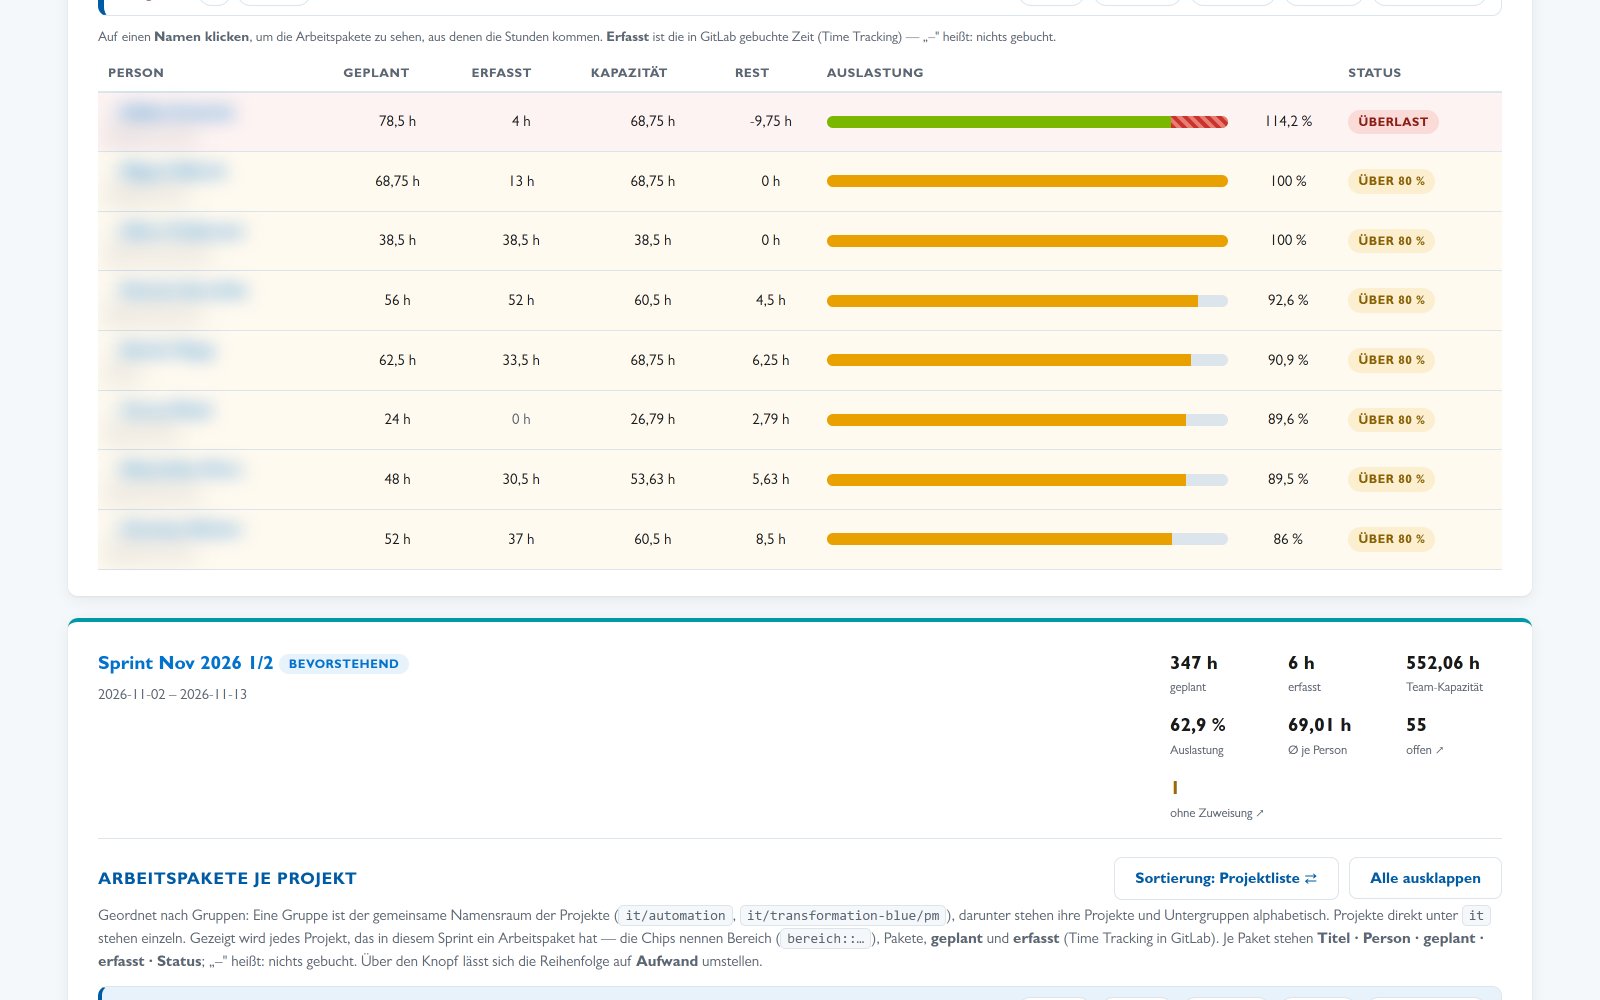
One row per person: planned, booked, capacity, remaining, utilization, status. Remaining is capacity minus planned; a negative value means overplanned. Status is a band: low, medium, good, very good, above 80%, overloaded above 100%. Every header has a tooltip, because the first question was what the numbers mean.
Planned is the sum of estimates for the packages assigned to that person, open and closed. Booked is the tracked time on the same packages. They sit in one row on purpose: plan and actual next to each other.
Clicking a name opens the packages behind the number: title, estimate, booked time, and status per package, plus the sum.
Work packages per project
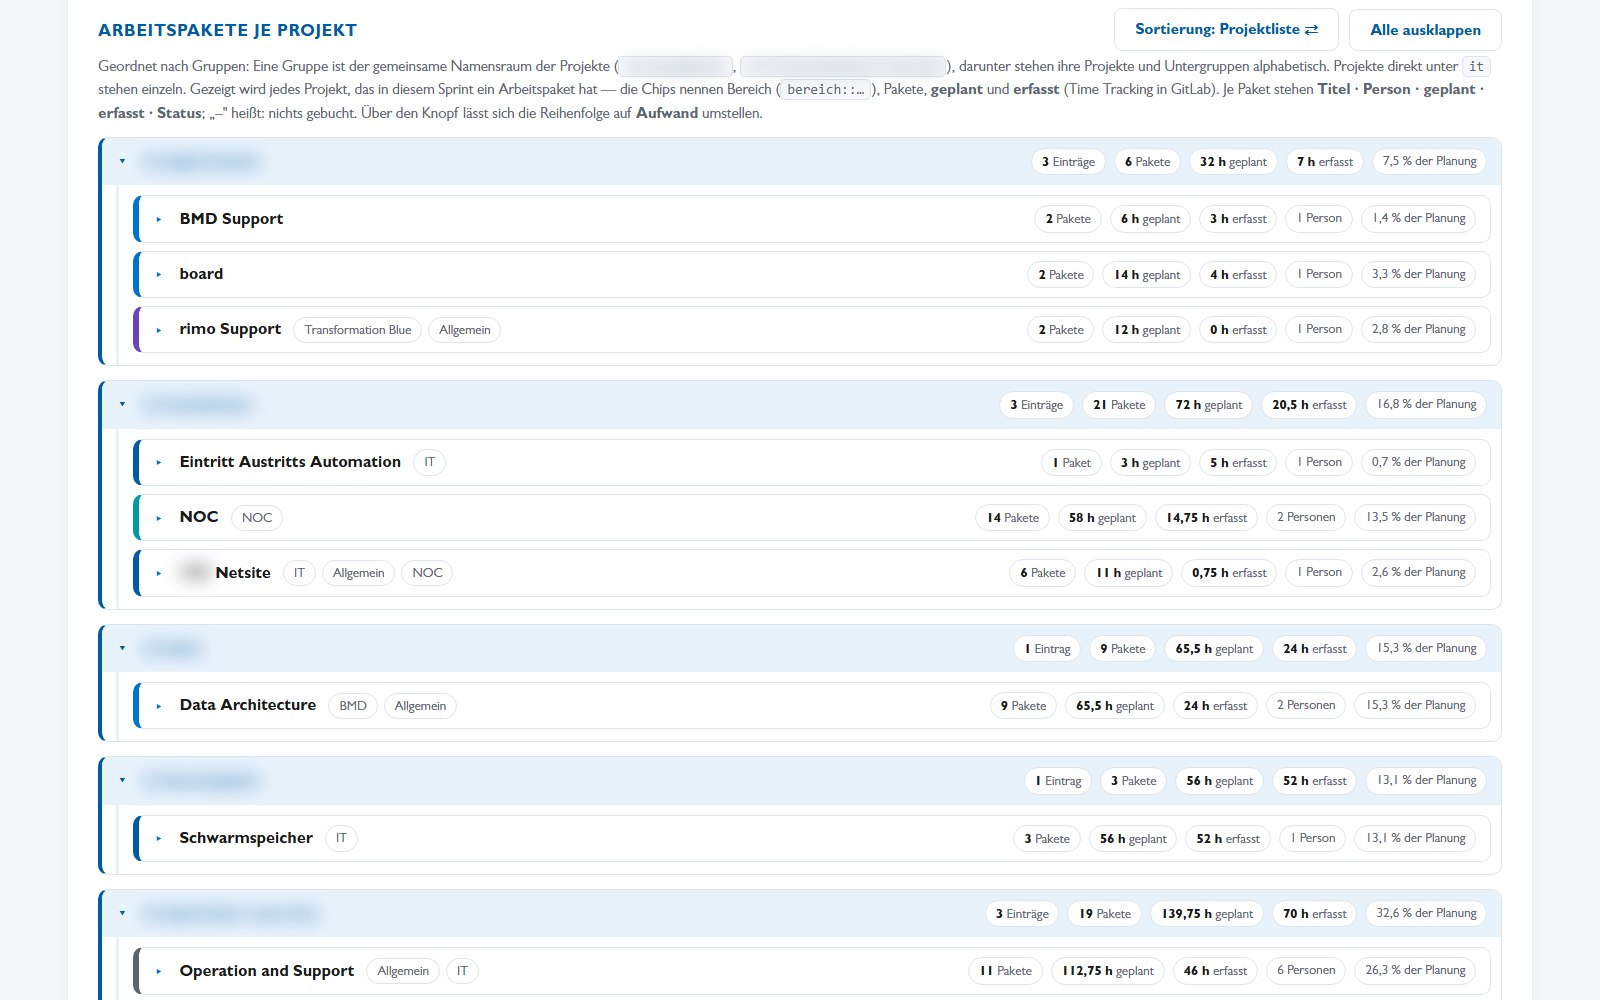
The second block in each sprint card groups packages by project. Group header and each project lane carry chips: area label, packages, planned hours, booked hours, share of the plan. Each row shows title, person, planned, booked, and status; a dash means nothing is booked.
Grouping is by project reference, not by area label. We learned that the hard way: with a fixed list of labels, a package with a new label disappeared while still counting in the sum. The project reference is always present, so nothing can fall out and a new project needs no code change.
A button switches between project list and effort.
From a number to the list behind it
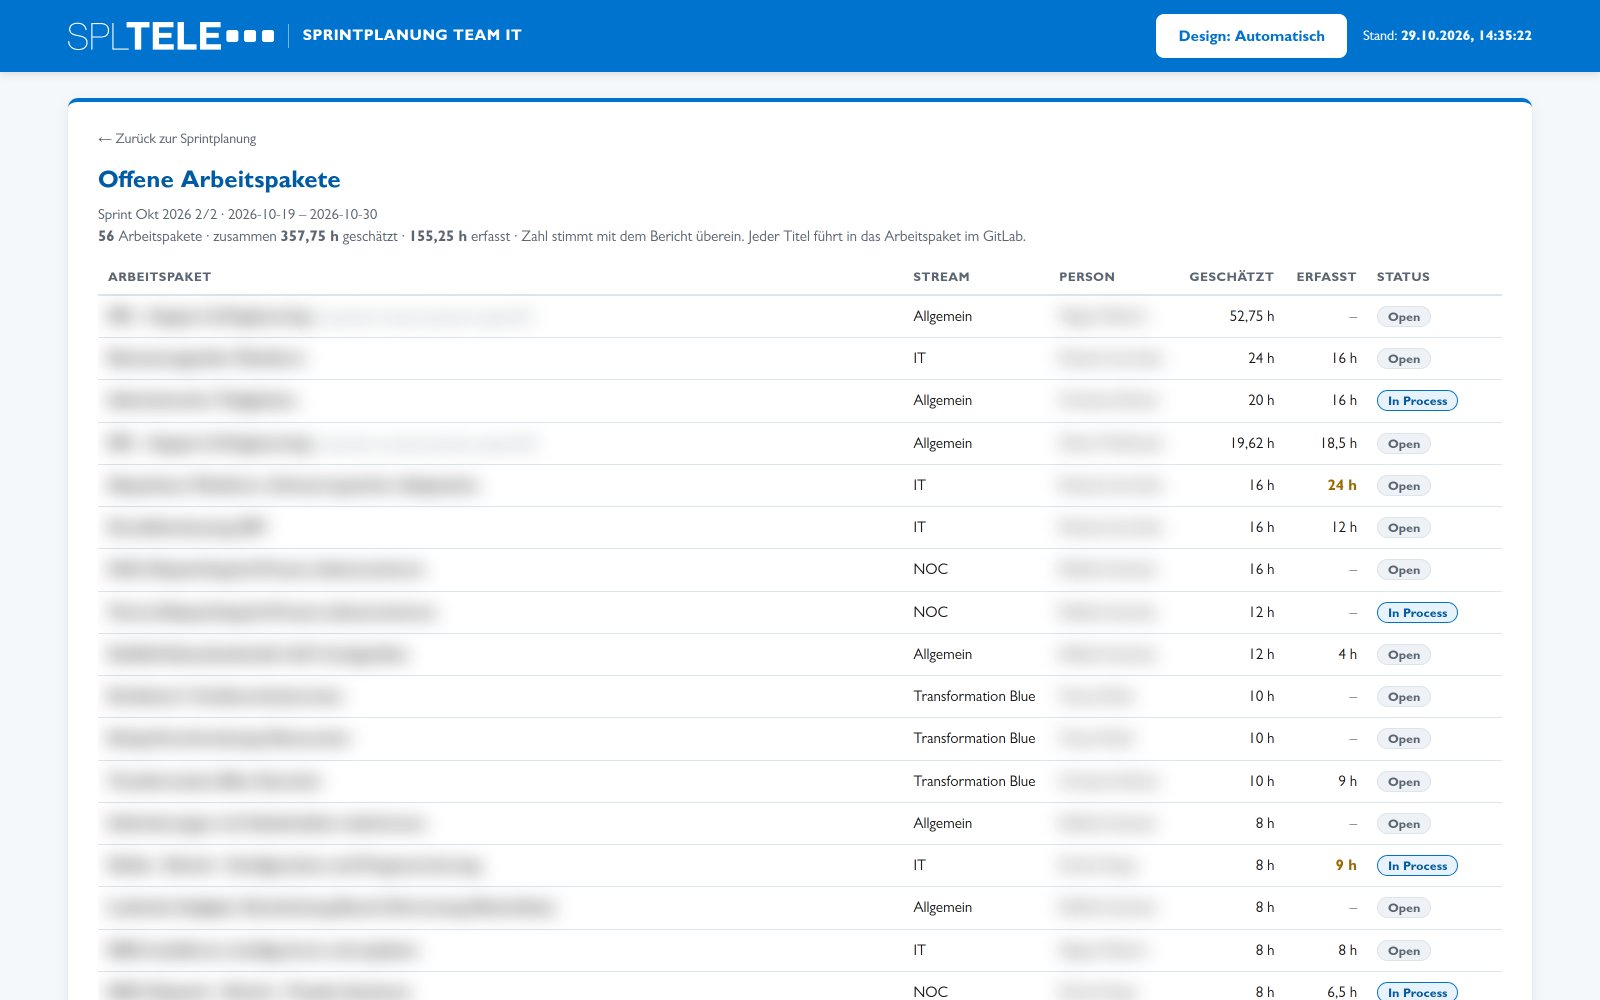
Two tiles are clickable; each opens a filtered list in a new tab: title, stream, person, estimate, booked time, and status, with sprint, date range, and sum of hours above.
The count on the tile and the rows must agree. Where they can differ, the page says why: the report is minutes old, the links on the sprint issue can be newer. A number that changes when you click it destroys trust.
The page also exposes its state as compact JSON for other tools. The management view on the same data is a separate application, described in From GitLab Issues to a Management Cockpit.
The backlog board
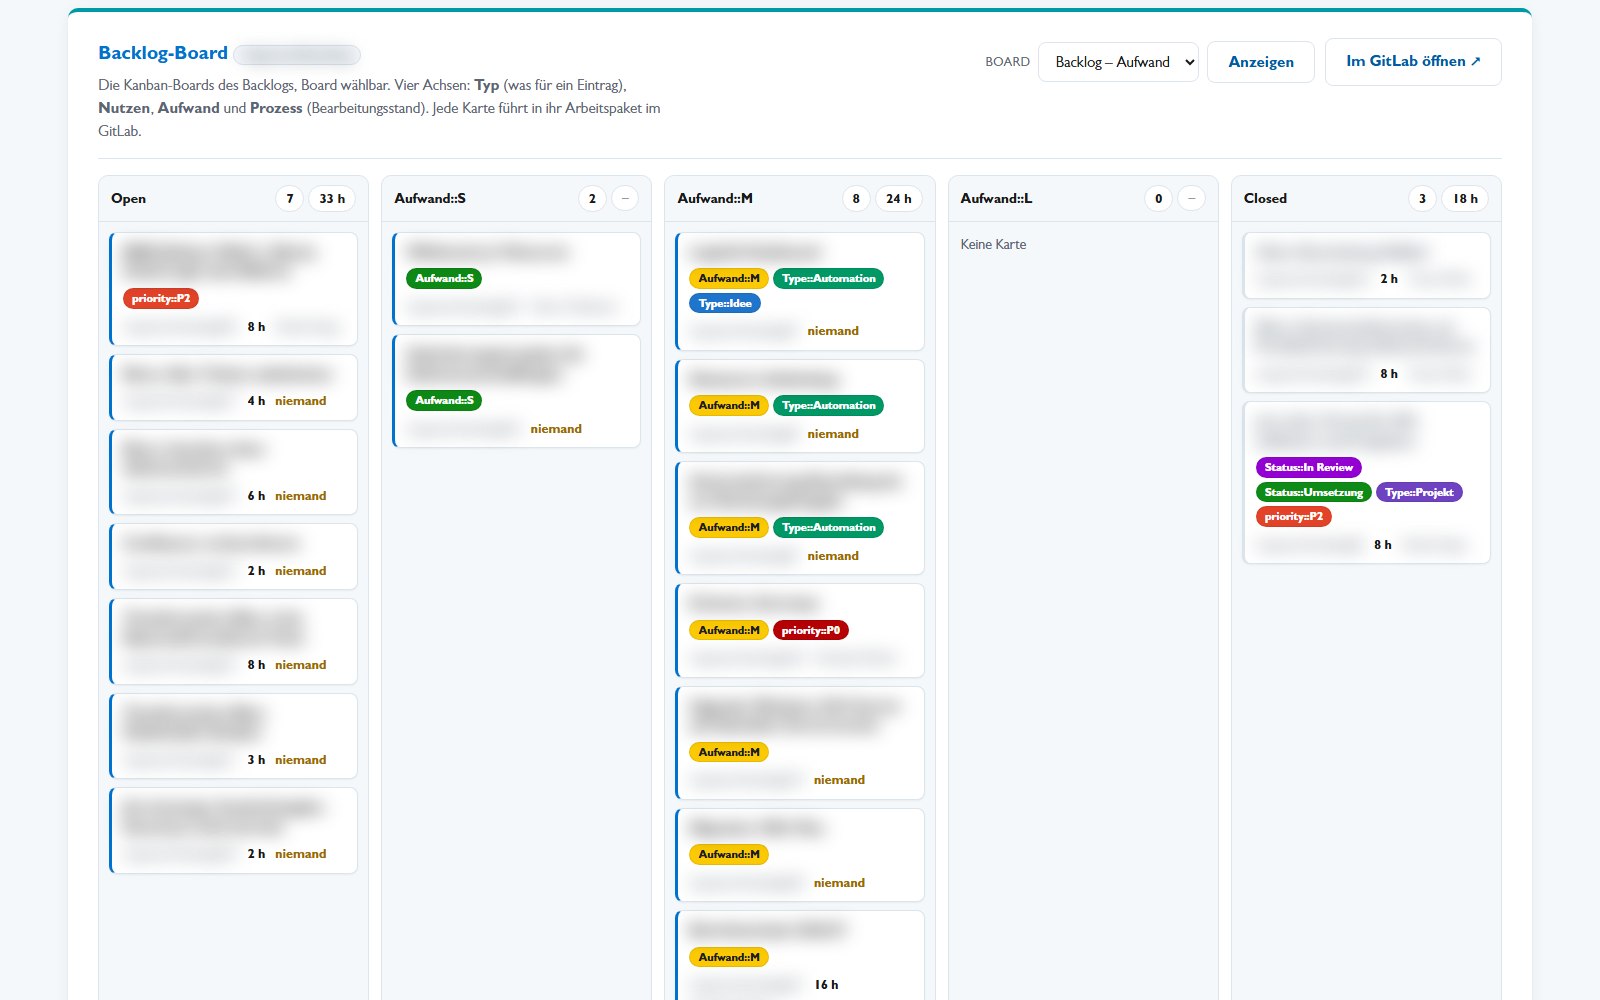
Not all work is in a sprint. The backlog board shows the four GitLab boards of our backlog project: effort, benefit, process, and type. A dropdown selects a board, columns follow the board order, each card carries labels, estimate, and person.
Column headers show the card count and the sum of estimates; the footer gives the total and how many cards have no estimate. Empty columns stay visible, because an empty column is information. The board is read-only.
It also shows tasks and other work item types that have no position on a GitLab board, marked with a type chip. Work that exists should be visible somewhere.
How the numbers are created
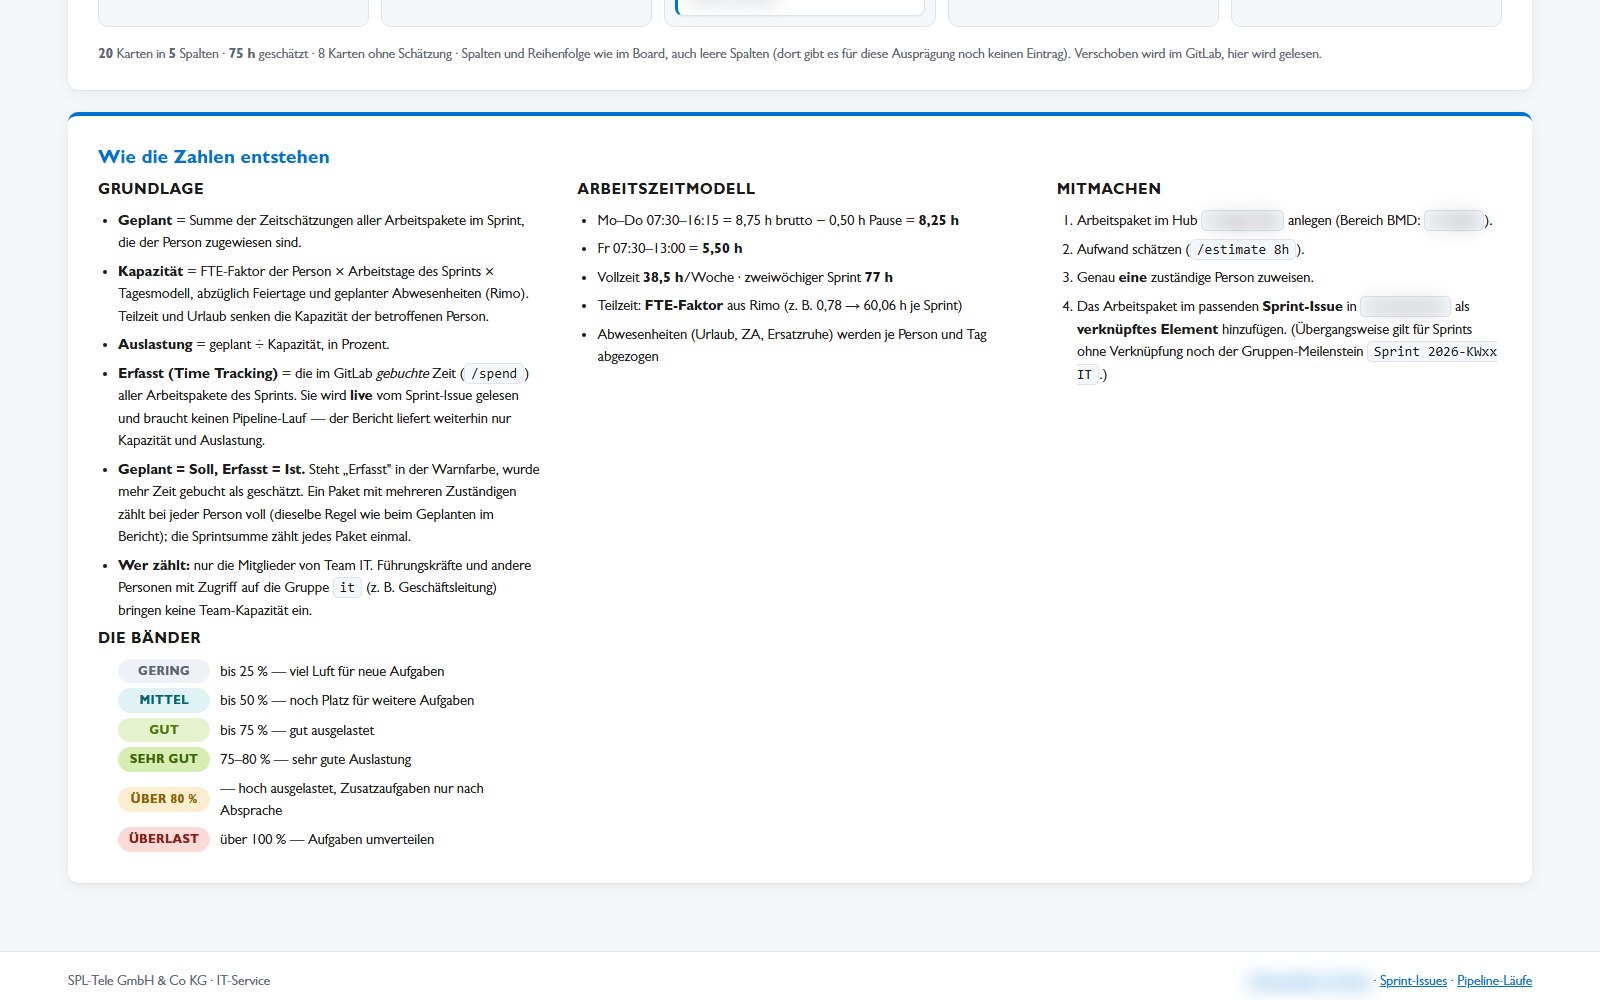
A closing section explains the model: planned, booked, capacity, utilization, the status bands, and the four steps to get a package into a sprint: create it, set an estimate, assign one person, link it to the sprint issue.
It exists because of a request: the numbers were not clear. A page can be correct and still be ignored if nobody trusts it. Definitions belong on the page, not in a wiki that drifts.
Light, dark, phone
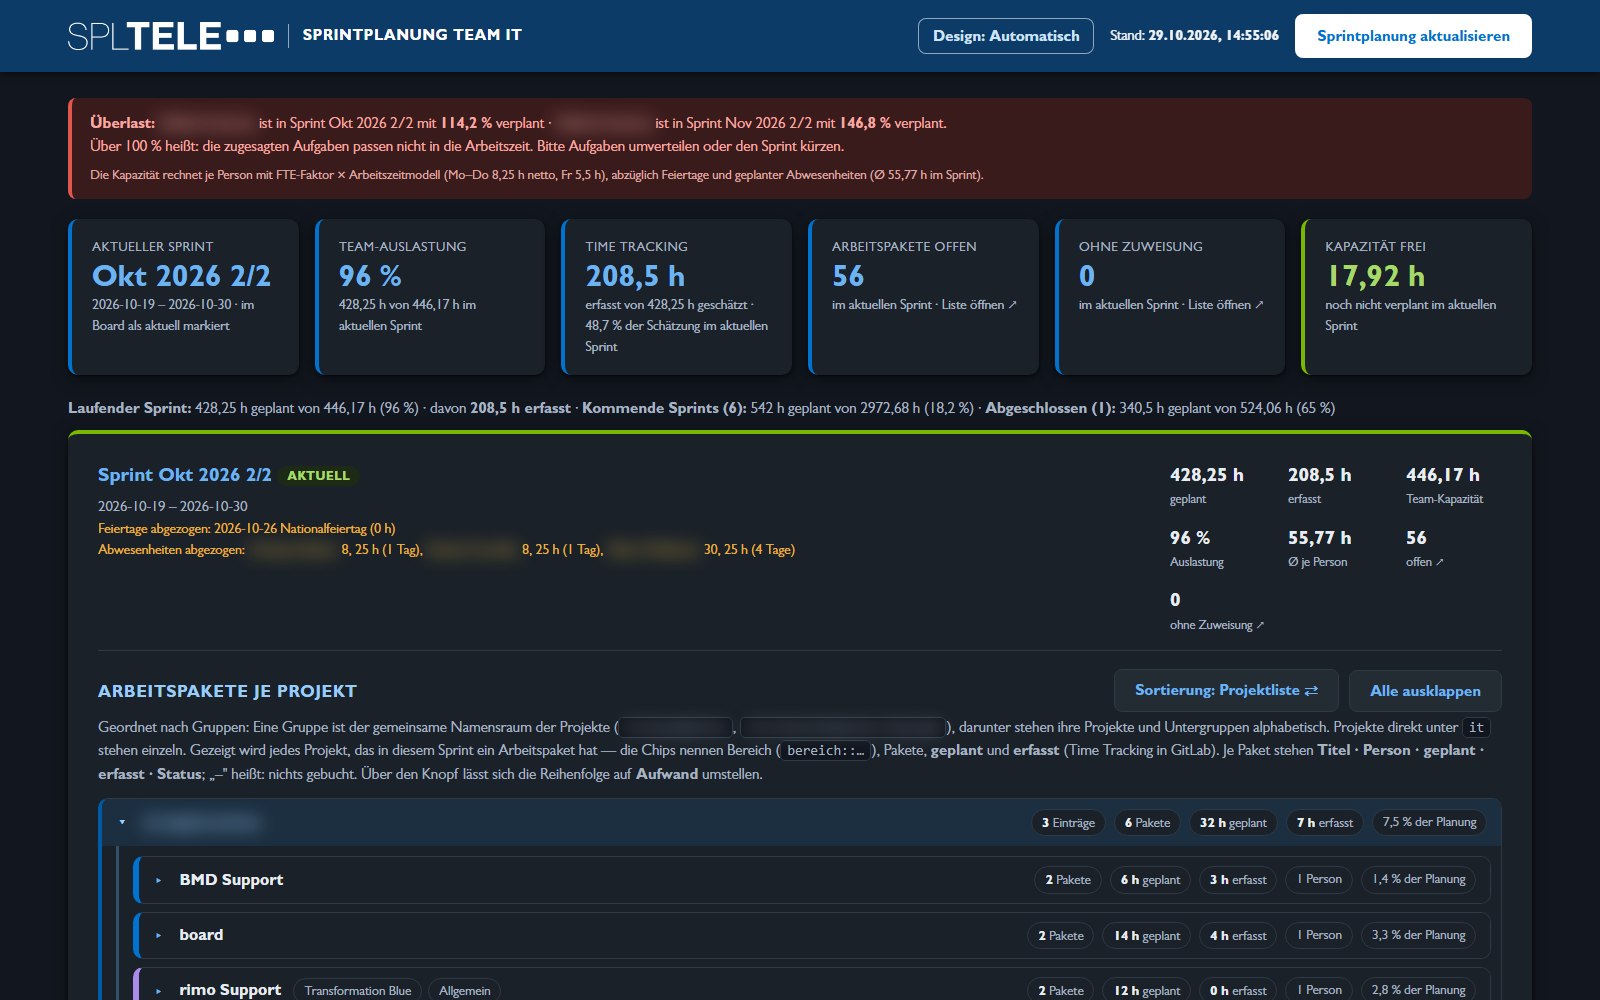
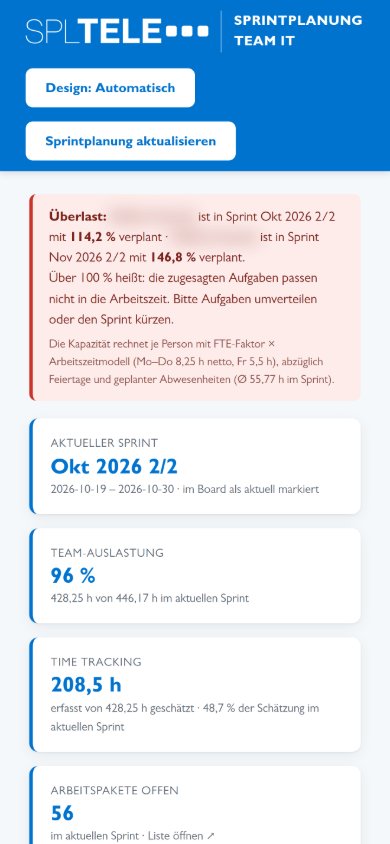
The theme follows the system by default. A switch cycles automatic, dark, and light and remembers the choice; the theme is applied before the first paint, so nothing flashes. Printing always uses the light theme.
The layout has two breakpoints. On a phone the cards stack, the tiles wrap, and the wide tables keep their columns by scrolling sideways.
What it does not do
- It is read-only by design. Planning happens in GitLab. The page never writes.
- Its quality is our data quality. A package without an estimate counts as zero hours. A missing absence makes capacity look higher than it is.
- The interface is German. Deliberate: the team works in German, and the tool is for the team.
- It does not replace the planning conversation: it shows where the plan does not fit; what to do stays a team decision.
- It is not a product. One internal page with one job. Tools like it are a side effect of how we work; the model behind that is described in our ALEM article.
We are not comparing GitLab editions here; if that decision is on your table, we wrote the comparison separately: GitLab CE vs. Premium for a self-managed team. The capacity view would be needed in both: capacity comes from contracts, holidays, and absences, not from a GitLab feature.